
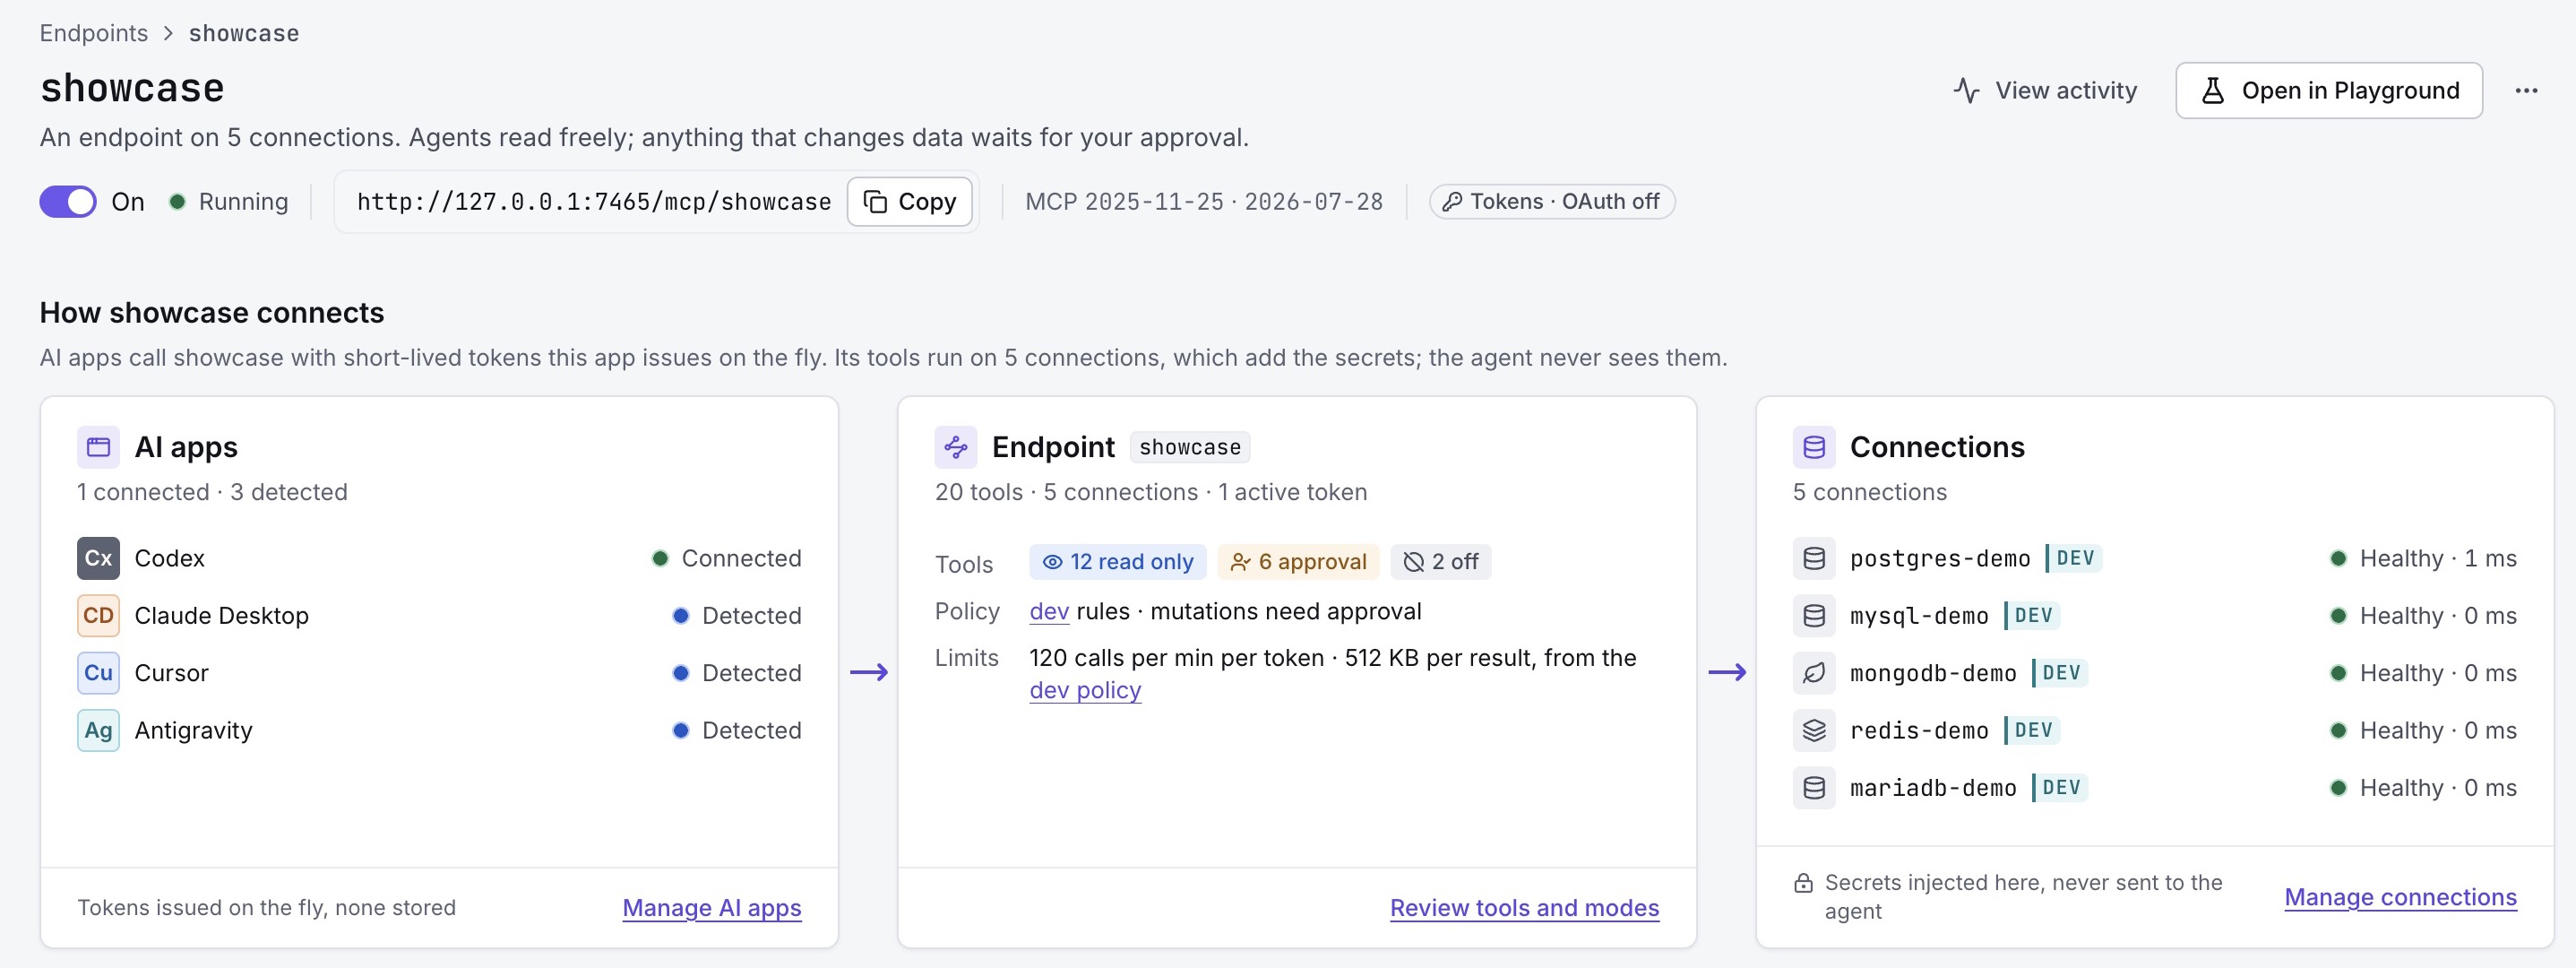
An AI assistant investigating a slow order-list endpoint needs enough PostgreSQL context to be useful: the schema, the SQL your ORM produced, a query plan, and sometimes workload statistics. If the investigation ends with a proposed data correction, it also needs a clear boundary between suggesting that correction and executing it.
GateRook and Postgres MCP Pro address different parts of this workflow. GateRook is a desktop MCP Firewall for AI access to databases and infrastructure: it combines encrypted credential storage, scoped connections, endpoint permissions, approval of specific actions, and a tamper-evident activity record. Postgres MCP Pro provides PostgreSQL tools with a particular emphasis on query plans, database health, and index analysis. Both support controlled read access. The useful choice depends on the work you want the assistant to do.
This comparison is published by GateRook. We reviewed the implementations and ran the GateRook read tests described below on November 5, 2026. Pro's capabilities are source-reviewed; its clean installation did not complete in our environment. The application screenshots were captured on November 5 from GateRook 0.7.0, using the PostgreSQL 16.13 fictional-order fixture. They show the current demo configuration and saved approval and verification events from our November 3 PostgreSQL walkthrough. The historical approved update and the new reads are identified separately throughout.
Choose by the task you need to complete
For a web developer, the dividing line usually appears in the question you ask the assistant.
| Task | Start with | Main capability |
|---|---|---|
| Inspect API data | Either | Schema and SQL tools |
| Investigate slow queries | Postgres MCP Pro | Plan and index analysis |
| Review a data correction | GateRook | Exact-action approval |
| Trace an AI operation | GateRook | Activity and decisions |
| Combine service context | GateRook | Multiple connector types |
| Run a headless server | Postgres MCP Pro | CLI and container workflow |
For example, an order-list investigation can begin with either product's PostgreSQL tools. Pro adds specialized analysis when the question turns to plans or index candidates. GateRook adds an application workflow for controlling which assistant can use a connection and reviewing proposed changes. Its other supported connectors can bring in logs or another database, provided each source is configured with appropriate permissions.
GateRook can return an ordinary PostgreSQL EXPLAIN plan; we exercised that below. The distinction is the additional analytical workflow that Pro supplies around PostgreSQL, rather than exclusive access to the planner. Conversely, Pro's restricted mode is a real access-control feature and should be included in a fair comparison. See the Postgres MCP Pro project (opens in a new tab) and the GateRook PostgreSQL guide.
What we checked, and what the results establish
The live database was the existing local tutorial fixture, gaterook_demo, running PostgreSQL 16.13. Its public.orders table contains four fictional orders and four columns: id, customer_name, status, and total. GateRook used the demo_agent login. We intended to use that same login for Pro so that a different database privilege set would not distort the comparison.
That login has CONNECT on the database, USAGE on public, and SELECT, UPDATE on public.orders. It is not the table owner and has no explicit INSERT or DELETE grant on that table. The update permission exists for the earlier approval demonstration. For a read-only investigation, create a separate login with only the reads you actually need; do not copy the extra UPDATE privilege merely to follow a comparison.
| Component | Version | Evidence |
|---|---|---|
| GateRook | 0.7.0 | Reads, source, application screenshots |
| Postgres MCP Pro | 0.3.0 | Source; installation blocked |
| PostgreSQL | 16.13 | Local fictional-order fixture |
GateRook's source review used tag v0.7.0; fresh sql_query calls returned rows and a JSON EXPLAIN plan. Pro's review used source tag v0.3.0. We made no new database mutations, extension installations, or index changes for this article.
Pro 0.3.0 was the latest published version we found in PyPI (opens in a new tab) and the project releases (opens in a new tab), dated May 16, 2025. Its repository was not archived. Our clean Python 3.12 installation with uv could not resolve the declared pglast==7.2.0 dependency from the package index. We did not override that dependency and then present the result as an unmodified release. Consequently, Pro examples below describe the tagged implementation; they are not successful execution transcripts. This installation result is specific to our attempt, not a claim that every installation method fails.
This is a capability comparison with a small GateRook demonstration, not a completed runtime comparison of both products. It does not measure throughput, production query latency, index-advisor quality, or resistance to every possible SQL bypass. The millisecond durations in application screenshots describe those individual demo calls; they are not a speed ranking.
Follow the credentials and the returned data
The two direct connection arrangements look like this:
Postgres MCP Pro, direct stdio connection

AI client
  -> launches the configured Pro process
  -> calls a PostgreSQL tool over MCP
Pro process
  -> reads its database connection configuration
  -> connects as the selected PostgreSQL role
  -> returns tool results to the AI client

GateRook, native PostgreSQL connector

AI client
  -> calls the selected GateRook endpoint
GateRook
  -> checks the tool mode and applicable policy
  -> pauses a request when approval is required
  -> supplies the saved credential to the PostgreSQL connector
  -> executes the allowed operation and records its outcome
  -> returns tool results to the AI client
In the GateRook connection form below, the database is reached on the local loopback interface. The assistant subsequently refers to postgres-demo; it does not need a database URI in each SQL tool call.
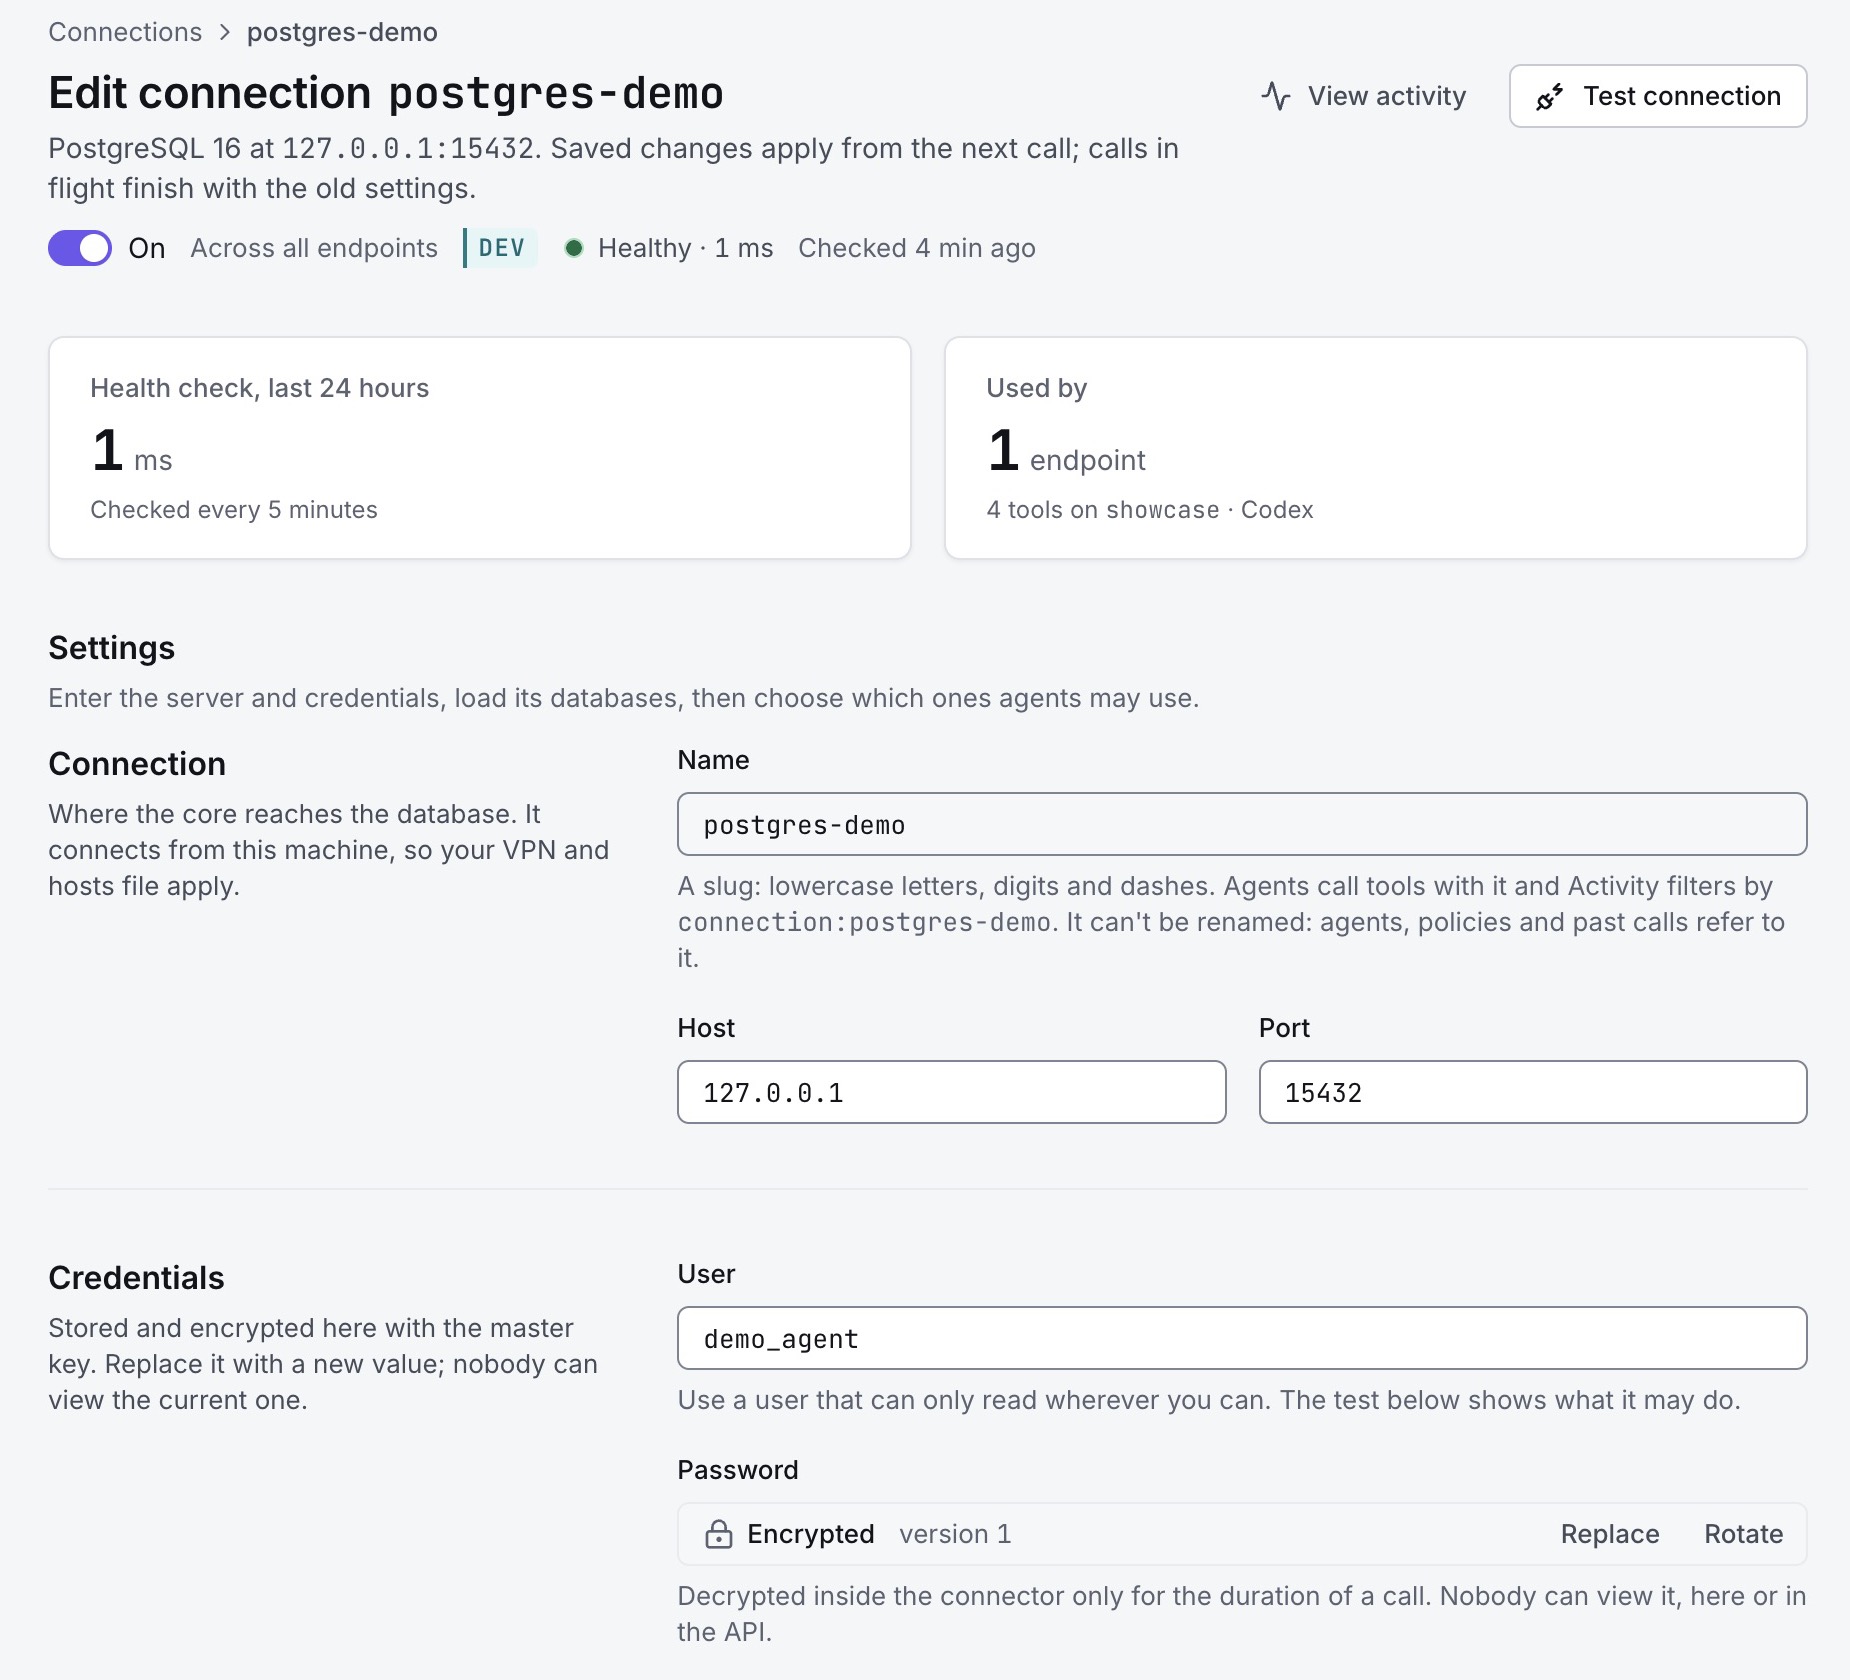
The saved tutorial connection uses 127.0.0.1:15432 and the dedicated demo_agent login. The password is stored encrypted and its value is not displayed. For a remote database, configure certificate and hostname verification for that server.
With Pro, provision the database URI through the server's supported configuration, including DATABASE_URI; protect the process environment or client configuration that supplies it. A URI stored in configuration is not automatically part of the model's conversation, but it remains accessible to the software receiving it. Neither arrangement removes the need to trust the client, connector, and operating system.
In both cases, selected rows and query plans travel back to the AI client. A cloud-backed client may send that material to its model provider. Local credential storage does not make returned business data local-only. Prefer the columns needed for the task, and treat values in rows, comments, and logs as untrusted data rather than instructions.
Configure a bounded PostgreSQL investigation
For GateRook, attach the connection to the endpoint used by the intended assistant. In this example, sql_list_schemas, sql_describe_table, and sql_query are in Read only mode, while sql_execute is in Approval mode. Bypass is available but is not selected.
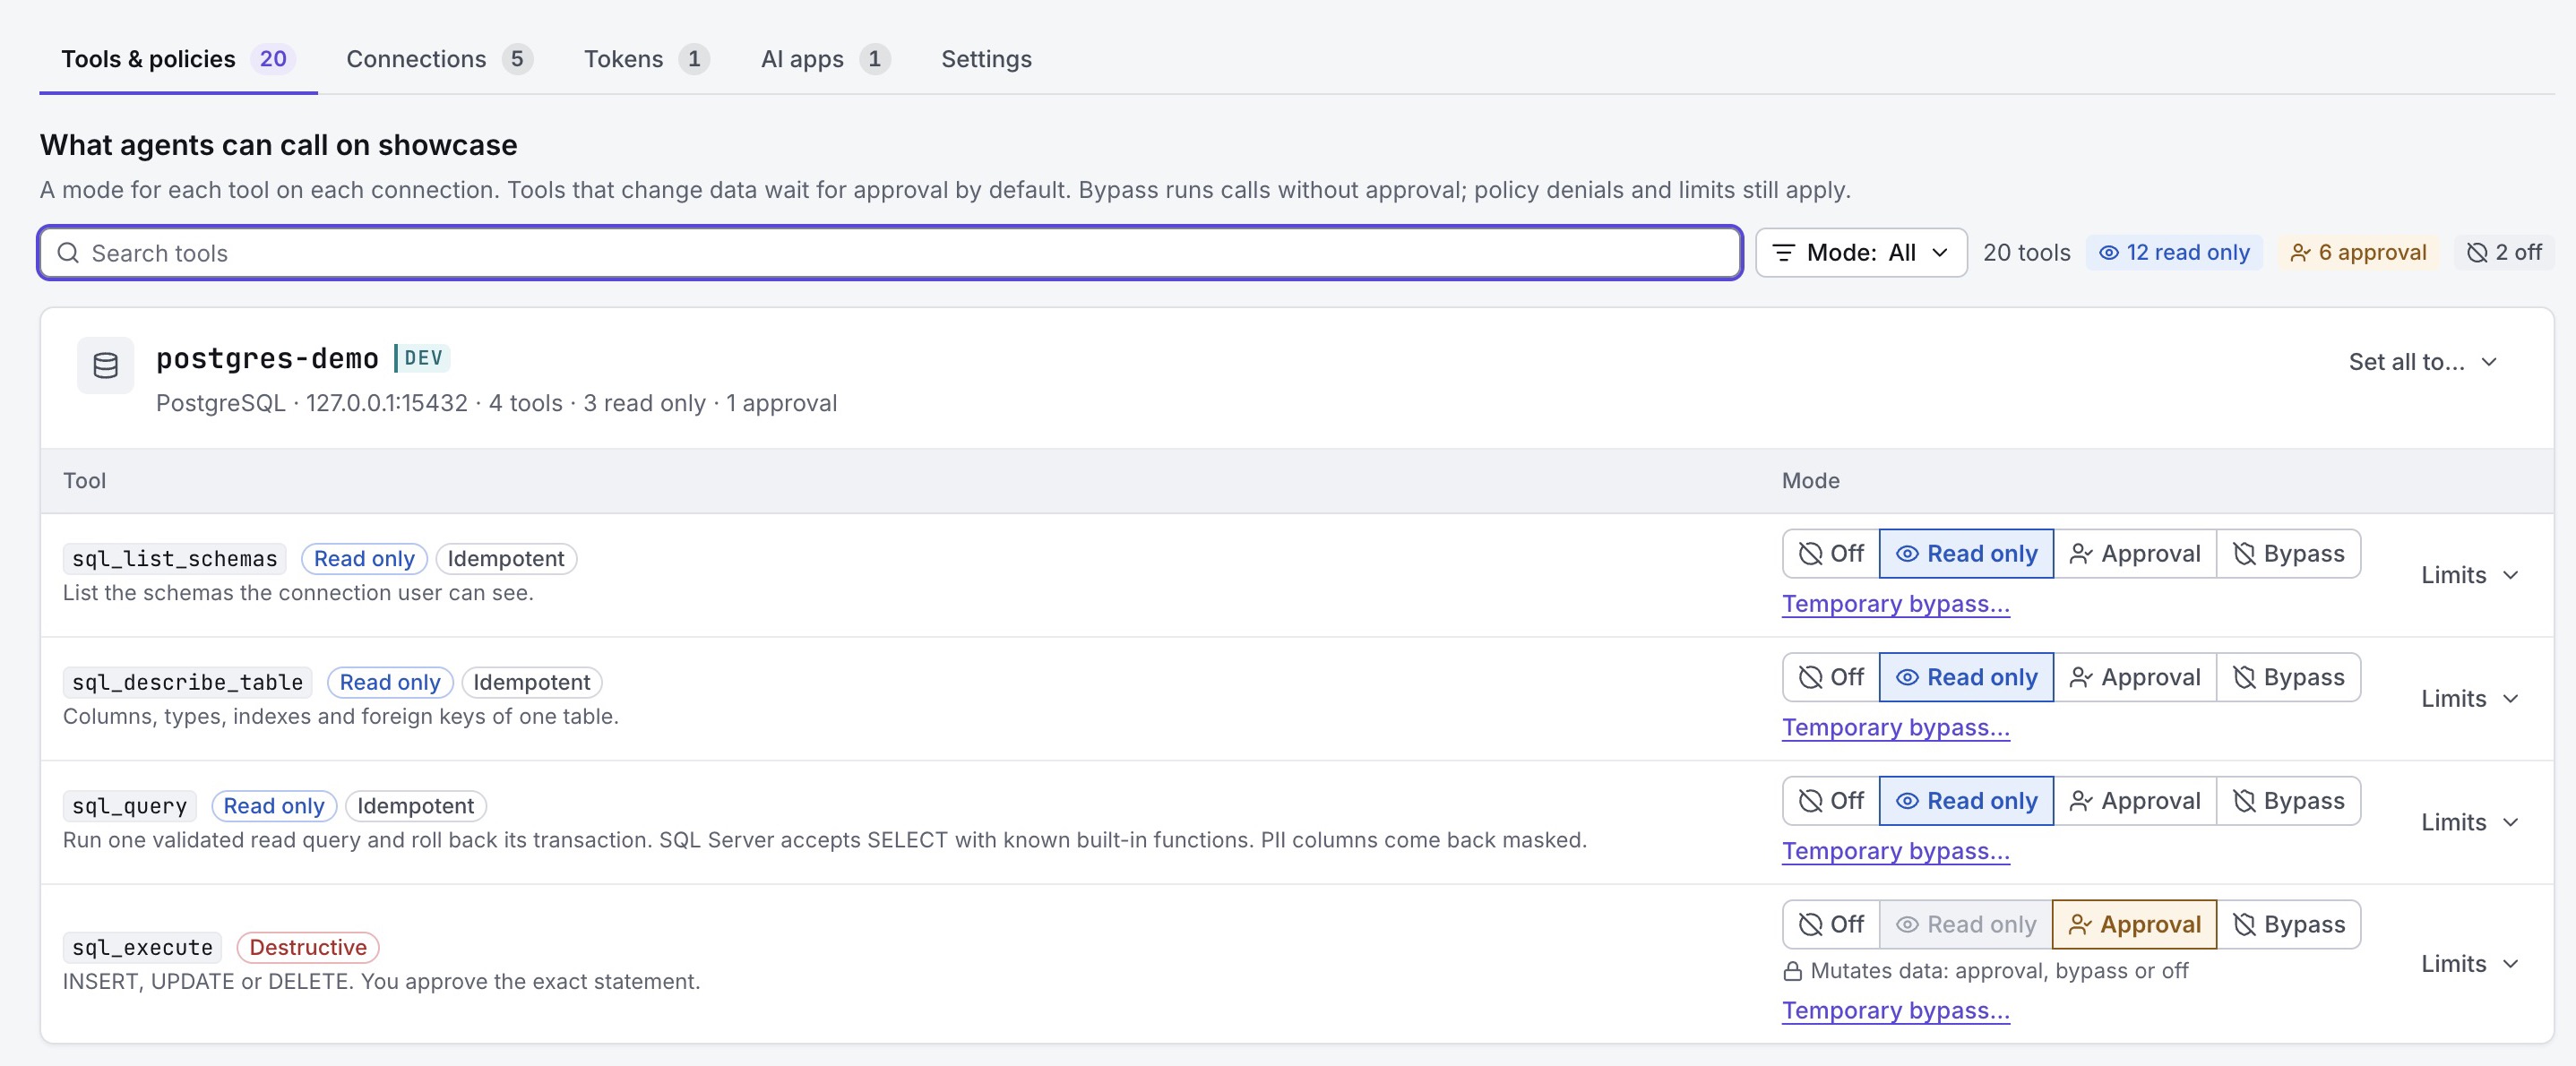
These modes are configuration choices for this endpoint. The write tool's approval setting is what makes the later correction wait for a person.
The demo read tool advertises a ceiling of 1,000 rows and a five-second timeout. The endpoint overview in the cover also shows a response-size budget. Our calls request ten or twenty rows. These controls address different things: a row cap bounds returned records, a response-size cap bounds bytes, and a timeout bounds execution time. A query returning one aggregate row can still scan a large table.
For an installed Pro 0.3.0 server, make the access mode explicit:
# DATABASE_URI is supplied by your protected process configuration.
postgres-mcp --access-mode=restricted --transport=stdio
This is a launch configuration example, not a workaround for the installation issue above. The reviewed CLI defaults to unrestricted, so omitting the flag changes the intended access model. That release supports stdio and legacy SSE. Its transport selection does not advertise Streamable HTTP. Pro CLI implementation (opens in a new tab)
Restricted mode parses SQL, checks allowed syntax and functions, and uses a PostgreSQL read-only transaction followed by rollback. Its driver applies a 30-second asynchronous timeout to each SQL execution; that is not a single total budget for an analysis tool making several queries. The base driver fetches all returned rows, so add SQL limits and do not assume a general output cap matching GateRook's configured limits. Restricted SQL implementation (opens in a new tab), SQL driver (opens in a new tab)
Keep PostgreSQL privileges as a separate boundary in either setup. An approval cannot grant a missing table privilege. Likewise, GateRook’s schema selection should not be treated as a replacement for database grants. For production, review role membership, accessible functions, views, and row-level security as well as direct table grants. PostgreSQL's privilege documentation (opens in a new tab) explains these distinct permissions.
Map an order query to each tool
Suppose the application exposes an order list filtered by status. Start with a small projection, rather than asking the assistant to dump the entire table:
SELECT id, status, total
FROM public.orders
ORDER BY id;
The GateRook call was:
{
  "connection": "postgres-demo",
  "database": "gaterook_demo",
  "sql": "SELECT id, status, total FROM public.orders ORDER BY id",
  "limit": 10
}
In Pro, the corresponding source-defined tool is execute_sql. Its argument shape is simpler because the server already has its configured database connection. A bounded equivalent for this fixture is:
{
  "sql": "SELECT id, status, total FROM public.orders ORDER BY id LIMIT 10"
}
Despite its name, execute_sql also serves reads. The selected access mode determines whether writes are permitted. We did not execute this Pro example. Pro tool definitions (opens in a new tab)
The live GateRook read returned:
| id | status | total |
|---|---|---|
| 1001 | shipped | 129.90 |
| 1002 | paid | 89.00 |
| 1003 | pending | 249.00 |
| 1004 | shipped | 49.50 |
Order 1001 is already shipped because the earlier walkthrough completed its approved correction. We did not reset that row or execute the update again for this comparison.
This result can answer a data question, such as why one order is absent from a pending-orders screen. It cannot establish why the HTTP request is slow. The API could also be waiting on connection acquisition, issuing repeated ORM queries, serializing a large response, or calling another service. Capture the actual SQL and relevant parameters from the web application's investigation before attributing its latency to PostgreSQL.
Read an EXPLAIN plan without inventing a performance result
We then asked PostgreSQL for the estimated plan of a bounded pending-orders query:
EXPLAIN (FORMAT JSON)
SELECT id, status, total
FROM public.orders
WHERE status = 'pending'
ORDER BY id
LIMIT 20;
GateRook accepted this through sql_query. The returned JSON had this plan shape; the following is a compact transcription of the relevant fields:
Limit                         estimated rows: 4
  -> Sort                     key: id
       -> Seq Scan on orders  filter: status = 'pending'

Top-level estimated cost: 19.04 .. 19.05
Pro exposes a dedicated explain_query tool. For the same query, its source-defined arguments would be:
{
  "sql": "SELECT id, status, total FROM public.orders WHERE status = 'pending' ORDER BY id LIMIT 20",
  "analyze": false
}
The SQL here omits the EXPLAIN prefix because the tool constructs it. We did not obtain a Pro plan in this run. Its plan-processing and hypothetical-index paths are visible in the tagged plan implementation (opens in a new tab).
The sequential scan does not establish a missing-index problem. This table contains only four rows. An index has its own access overhead, and a plan chosen for a miniature fixture says little about a production table with different size, distribution, and statistics. The estimated four matching rows also differ from the one pending order currently in the fixture; planner estimates are not a live count.
For a real investigation, read the plan from the scans upward: which rows are filtered, where joins happen, whether a sort is required, and how many rows each stage is expected to produce. The cost values are planner units, not milliseconds. PostgreSQL's EXPLAIN guide (opens in a new tab) describes these fields and how the planner chooses among alternatives.
EXPLAIN ANALYZE changes the experiment
Plain EXPLAIN asks for a plan. Adding ANALYZE runs the statement and adds observed execution statistics. For example, on a suitable test database, an investigation might separately use:
EXPLAIN (ANALYZE, BUFFERS, FORMAT JSON)
SELECT id, status, total
FROM public.orders
WHERE status = 'pending'
ORDER BY id
LIMIT 20;
We did not run this command for the comparison. Even a read can consume CPU, I/O, memory, and connection capacity. An analyzed mutation executes its effects if the surrounding controls permit it. Choose the database, role, statement, and time budget deliberately; an ANALYZE flag is an execution decision. See the PostgreSQL EXPLAIN command reference (opens in a new tab).
There is a version-specific distinction: Pro 0.3.0 exposes an analyze option, but its restricted validator rejects EXPLAIN ANALYZE. GateRook's classifier examines the inner statement, so an analyzed SELECT and an analyzed UPDATE are different cases. A tool parameter being present does not mean every access mode permits it. Pro validator (opens in a new tab), GateRook classifier (opens in a new tab)
For web applications, compare a plan with the query your driver actually sends. Parameter values, prepared statements, data skew, and pagination can change the useful index strategy. A literal query copied into a chat is an investigation aid, not proof that every execution of the application query has the same plan.
Where Postgres MCP Pro adds specialized analysis
The useful extra layer is a set of purpose-built diagnostic tools:
| Pro tool | Purpose |
|---|---|
explain_query | Plans and hypothetical indexes |
get_top_queries | Workload query ranking |
analyze_query_indexes | Indexes for supplied queries |
analyze_workload_indexes | Indexes for a recorded workload |
analyze_db_health | PostgreSQL health checks |
Top-query ranking can consider total time, mean time, or resources. The explicit-query index API accepts up to ten queries, with a narrower limit for its optional LLM method described below. Health checks cover areas such as indexes, connections, vacuum, replication, and buffer behavior.
These features require more context than a successful SELECT on an application table. Workload ranking uses pg_stat_statements, while hypothetical-index evaluation requires HypoPG. Read the top-query implementation (opens in a new tab), index-analysis implementation (opens in a new tab), and health implementation (opens in a new tab) for the reviewed release's scope.
For pg_stat_statements, first-time setup includes loading the module through shared_preload_libraries, which requires a server restart, and enabling the extension in the relevant database. The visibility of other users' query text also depends on privileges. A developer with access to one orders table may therefore lack the information needed for a workload-wide diagnosis. Arrange the monitoring role and extension setup with the database owner; do not give the AI a superuser login merely to make a report work. PostgreSQL pg_stat_statements documentation (opens in a new tab)
Pro also offers an optional llm index-analysis method. In the reviewed code, that method requires OPENAI_API_KEY, uses an additional OpenAI API call, and sends material including query text, plans, and candidate indexes. Version 0.3.0's LLM optimizer accepts one query per analysis; the default dta path supports the list of up to ten and does not use that LLM optimizer. This is an additional data-processing choice to review, separate from the AI client already connected to MCP. Optional optimizer implementation (opens in a new tab)
GateRook's native PostgreSQL inventory provides four general SQL tools, including table descriptions with index information. It does not provide equivalent dedicated workload or index-advisor tools in this version. An assistant interpreting a returned plan can still be useful, but that is a different capability from a built-in advisor. GateRook SQL tool inventory (opens in a new tab)
A hypothetical index is a candidate, not a deployed improvement
For our filter-and-sort query, an index beginning with (status, id) is a possible candidate to investigate on a representative dataset. It is not a recommendation to add an index to this four-row fixture.
HypoPG lets a planner consider hypothetical indexes held in the connection's memory. It does not create the actual index pages or prove a measured latency improvement. Its hypothetical indexes are used with plain EXPLAIN, not EXPLAIN ANALYZE. That makes the mechanism useful for screening candidates before paying the build and storage cost. See the HypoPG documentation (opens in a new tab).
Before adopting a candidate, compare it with existing indexes and the real workload. A faster order-list query may not justify another index if the write cost, storage, or overlap with an existing index is excessive. Test with realistic cardinality and predicates, then put the actual schema change through your normal migration review.
For example, a developer might evaluate this migration separately:
-- Candidate for a representative test database; not executed here.
CREATE INDEX CONCURRENTLY orders_status_id_idx
ON public.orders (status, id);
CONCURRENTLY has specific operational rules, including that it cannot run inside a transaction block. It does not make index creation free of resource use or failure handling. GateRook's native SQL execution uses transactions, so this particular command is unsuitable for that execution path. Ordinary DDL availability also depends on policy and database permissions; GateRook does not categorically reject every CREATE INDEX. The demo role does not own orders, so its successful reads and updates do not authorize creating this index. Follow PostgreSQL's CREATE INDEX documentation (opens in a new tab) and the GateRook transaction implementation (opens in a new tab).
Where GateRook adds a reviewed change workflow
A performance investigation may reveal a data issue instead: an order was left in the wrong state. The earlier GateRook walkthrough demonstrated the following correction:
UPDATE public.orders
SET status = 'shipped'
WHERE id = 1001 AND status = 'pending';
The primary-key condition identifies the intended order. The status condition checks that its starting state still matches the request when PostgreSQL executes the update. This is useful protection against a stale assumption between inspection and execution, though real application workflows may need additional business rules, version checks, or an application API rather than direct SQL.
With sql_execute in Approval mode, GateRook returned a pending handle before executing the operation. The person reviewed the connection, environment, exact SQL, and impact preview in the application, then approved the request.
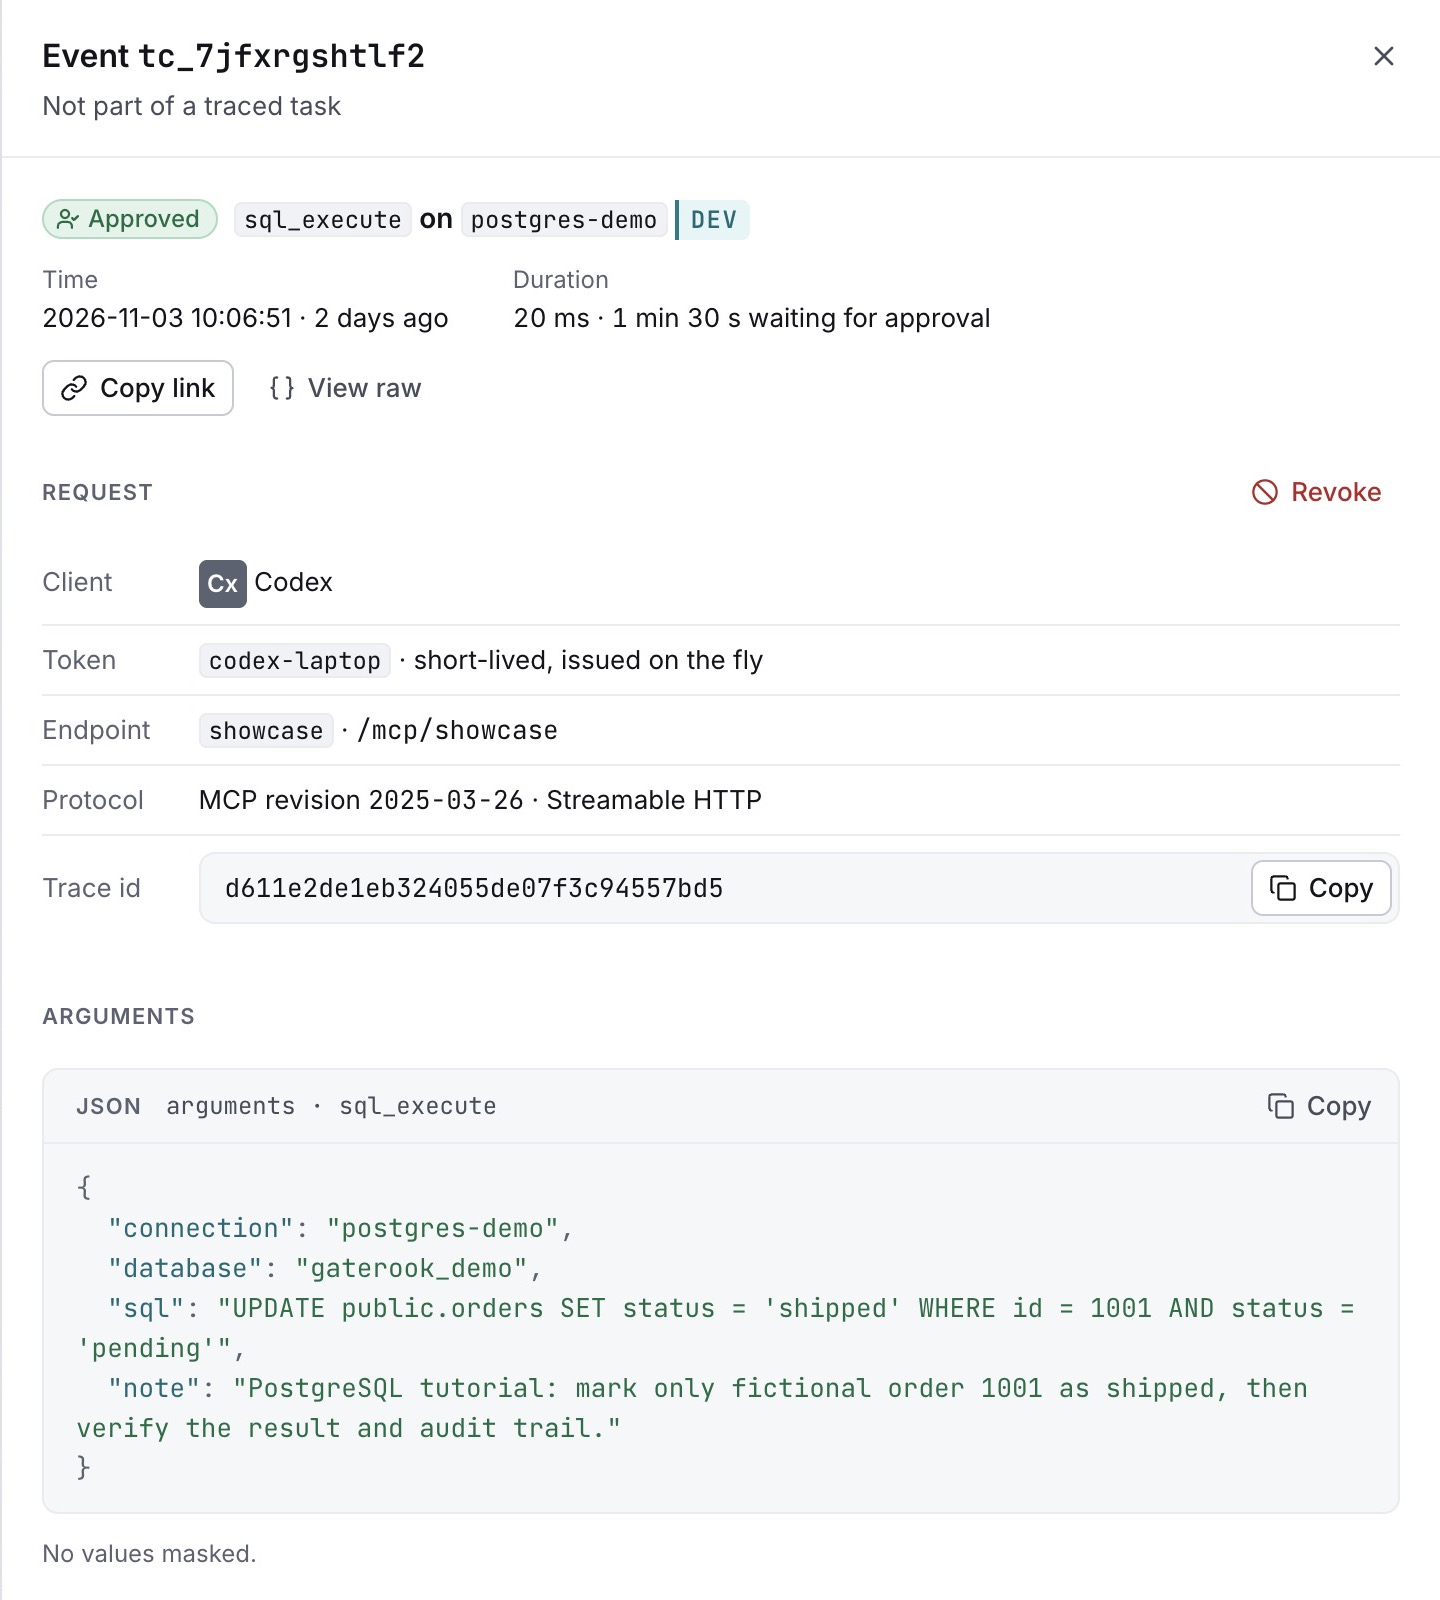
Historical demonstration from November 3: the SQL targets order 1001 only while its status is pending.
The preview's estimated row count is a planning estimate. It is not a hard maximum on the rows a mutation can change, and the read-result row limit is not a write limit. The execution result is the evidence for the actual affected-row count.
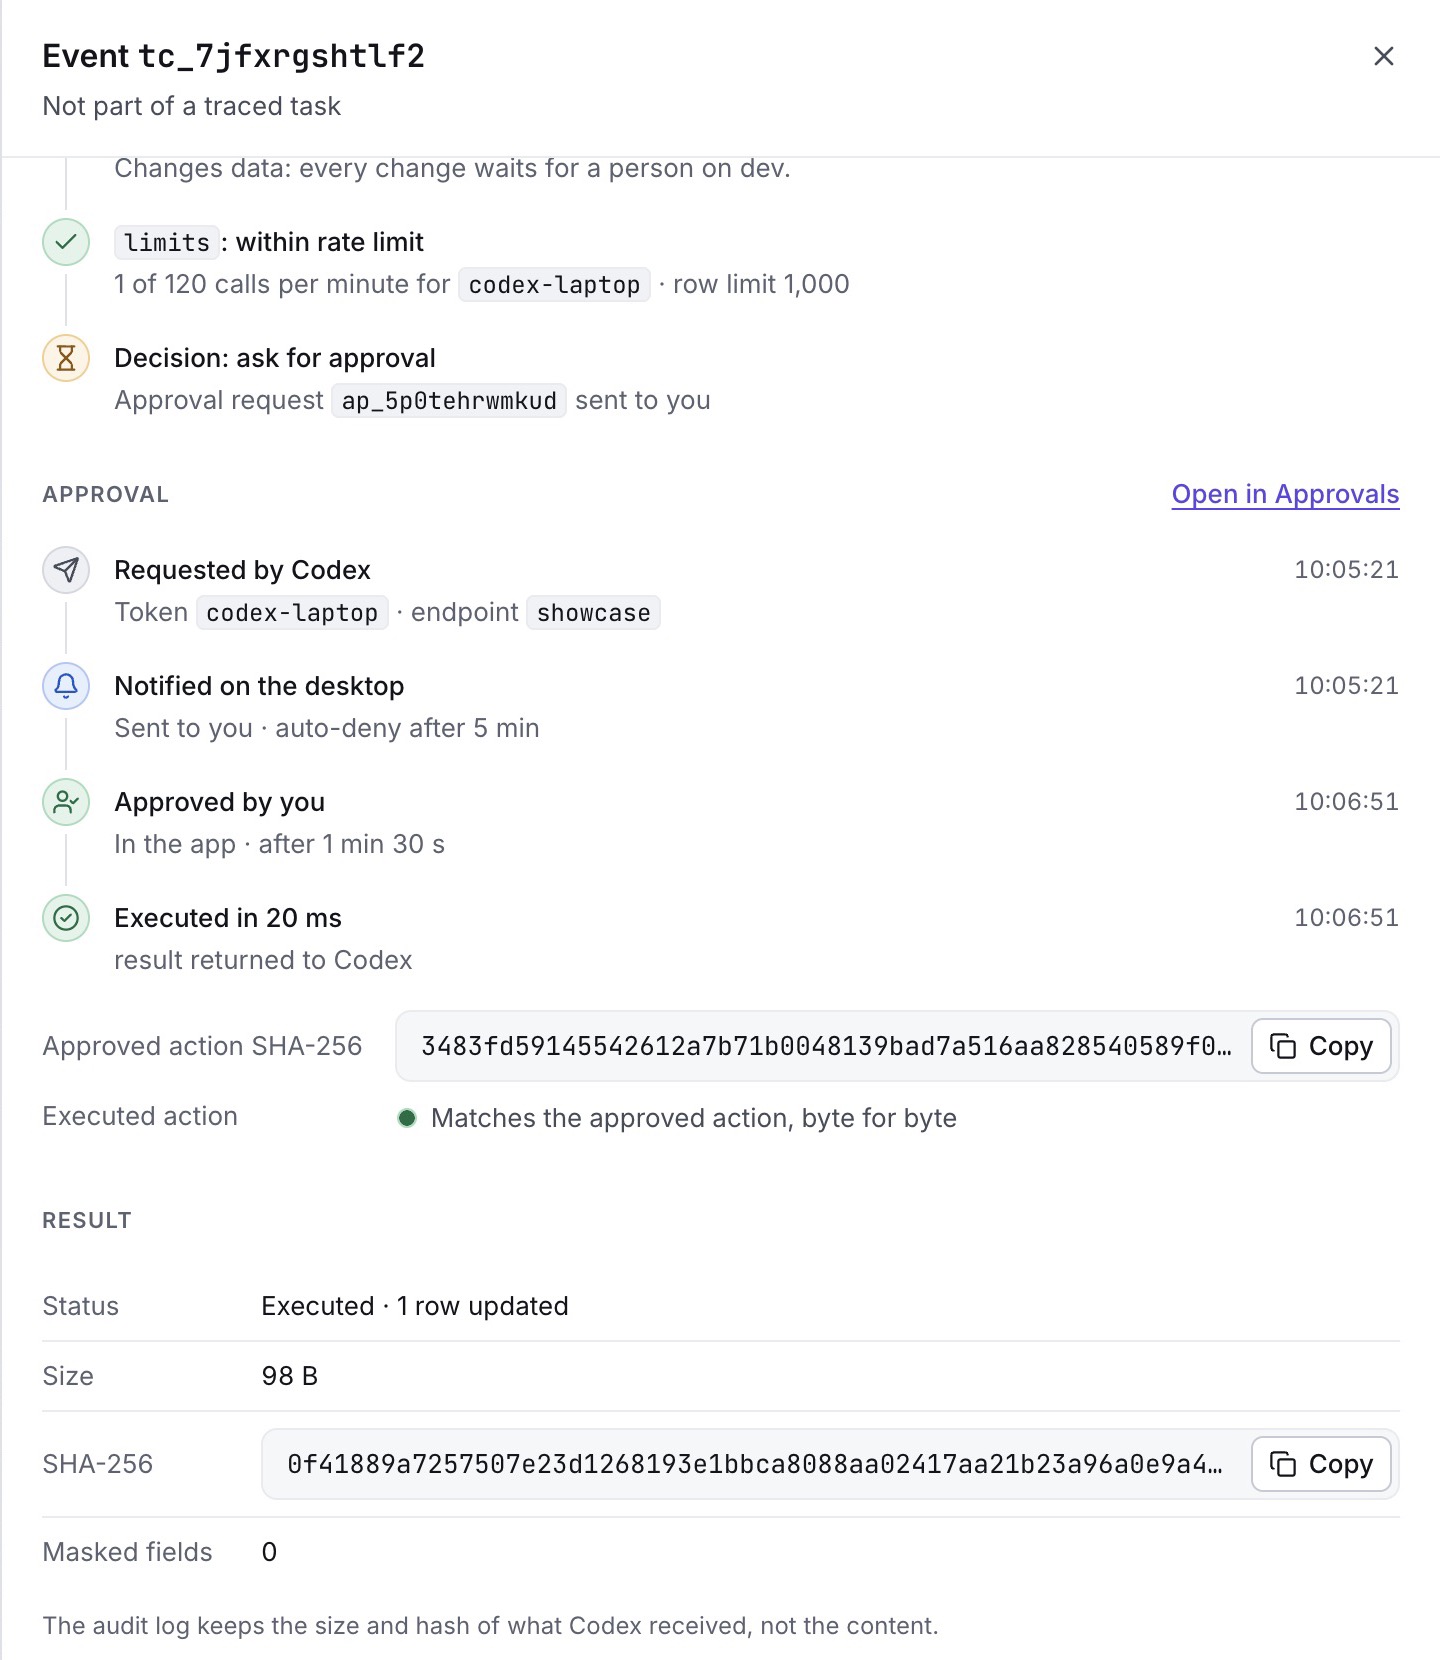
The recorded event reports one updated row and connects the request, approval, and execution. It also reports that the executed action matches the approved action.
The assistant should follow the existing approval handle until it reaches a terminal result. Submitting the SQL again creates another operation and can duplicate a change. Opening an approval card is not the same as approving the request in GateRook. A denial or expiry should be reported as such.
An approval is also not an automatic undo mechanism. After a successful commit, verify the resulting state and use a separate, reviewed recovery action if the business outcome is wrong.
SELECT id, customer_name, status, total
FROM public.orders
WHERE id = 1001;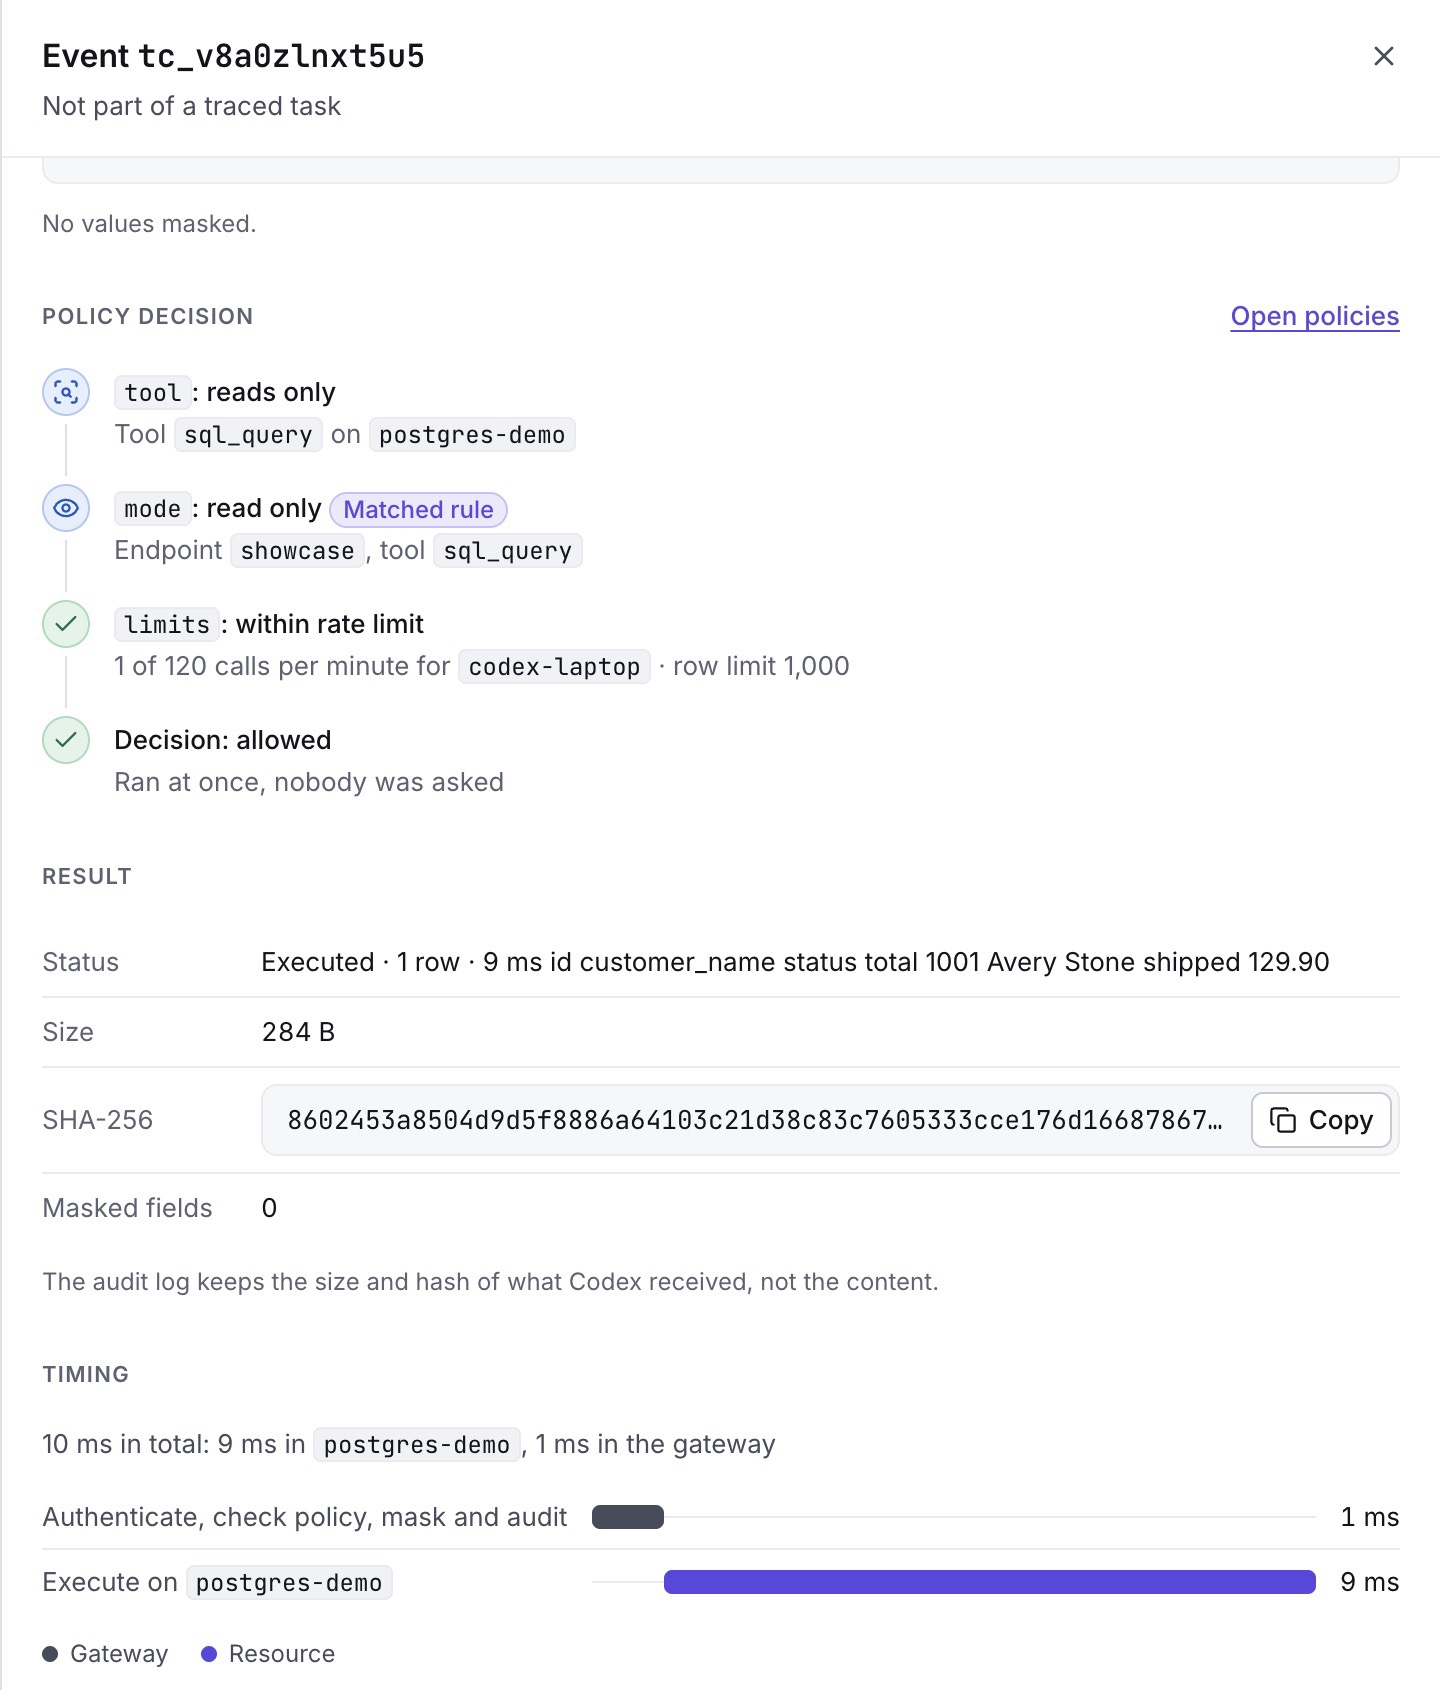
The original follow-up read confirmed shipped. Our new comparison read found the same saved status on November 5.
Activity helps answer who requested a call, which connection it used, which decision applied, and what execution reported. It is not a complete database backup or a guarantee of an immutable audit archive. In these read events, the application retains a summary, size, and response hash rather than a full result archive.
Compare the controls without treating either as a universal boundary
| Control | GateRook demo | Pro 0.3.0 source |
|---|---|---|
| Read transaction | Read-only, then rollback | Same in restricted mode |
| Write path | Approval selected | Blocked in restricted mode |
| SQL time budget | Five seconds for demo reads | 30 seconds per SQL execution |
| Generic output cap | Configured rows and bytes | Base driver uses fetchall() |
| Human review | Desktop approval workflow | Client may add confirmation |
| Evidence | Activity and execution record | Database diagnostic reports |
GateRook combines SQL classification with applicable scope and function policies. Pro's restricted path combines syntax and function validation with its database read-only transaction. Pro's unrestricted mode instead uses the database role's permissions; the reviewed server does not supply a comparable desktop approval queue. A client's own confirmation is a separate control.
The GateRook demo permits up to 1,000 returned rows per read, within its configured response-size limit. Pro's generic SQL driver has no equivalent result cap in the reviewed code, although individual analytical tools have their own result limits. Database-health reports and GateRook's client, decision, approval, and execution records also answer different questions.
The comparison uses the GateRook read rules (opens in a new tab), PostgreSQL transaction setup (opens in a new tab), and Pro implementations cited above. The screenshot configuration is one deliberate choice, not a claim that every GateRook endpoint always requires approval.
A restricted SQL mode and a human approval step solve different problems. A read-only mode prevents permitted query execution from becoming an ordinary persistent write. A review step lets a person decide whether a particular proposed action should run. Neither establishes that the returned data is appropriate to send to an AI provider, nor that the approved change is correct for your business.
Similarly, controls on one MCP connection do not constrain an assistant's unrelated shell, direct database connection, or another MCP server. Inventory all access paths before relying on a particular endpoint's policy. If you connect an external MCP server through GateRook, review that integration separately. This article compares the native GateRook PostgreSQL workflow with Pro's direct-server design; Pro running behind GateRook was not tested.
A practical choice for a web development team
Choose Postgres MCP Pro when the immediate need is PostgreSQL-focused diagnosis: understanding plans, exploring workload costs, and evaluating index candidates. Give its diagnostic role the visibility it needs deliberately, keep restricted mode explicit for read investigations, and verify extension prerequisites before expecting all analytical tools to work.
Choose GateRook when the immediate need is a controlled route from an assistant to your services: selected connections, bounded reads, per-tool modes, approval of particular changes, and a visible activity trail. Its ordinary SQL tools can support a plan investigation, while dedicated workload and index-advisor features remain a separate requirement.
Whichever route you choose, begin with a small, realistic question from your application. Inspect the schema, retrieve only the needed columns, establish what a plan actually says, and verify the outcome of any subsequent change. For the complete connection and approval walkthrough shown here, continue with PostgreSQL in GateRook. Use Getting started to connect an AI client, or the integration catalog to check additional service coverage.